Proposal Phase 3
The following section includes detailed design document (Something every engineer will spend a lot of time on. Often the more time spent here the less time it takes to get the project work complete as you will save time by avoiding creating project elements that you may just have to throw out or redo)
High Level Architecture - Summary
This section will most likely be hard to create.
See this document on some high level architecture diagrams that you can consider creating. We’ll review and go over some of these in class as well. Feel free to add other standard software design diagrams as appropriate to your project.
Ask yourself, “What is the difficult part about the project? How will I solve that problem?” If there is nothing difficult about the project, then the project may not be complex enough. If you don’t know how to solve the problem, ask, “How will I learn to solve that problem?” Explain all of that here.
Lastly, consider what classes you will create, their roles & responsibilities, how your classes will interface with one another, where data will come from, and what data structures will be used. If there are lots of data sources and paths, making a diagram can help add clarity. Many projects will not require a Data Flow Diagram.
Detailed Schedule
Revise your weekly milestones with detailed tasks for each week (minimum 4 tasks / week - 2 per team member).
Include a link to your detailed task list here as well as the markdown version inline (make sure to paste the markdown after you convert your document to markdown)
Create your task list from this template (You may modify but you should keep this as the minimum required information for a task list).
You must include your phase 3 detailed task list in this document as markdown. (See below for an example; you can convert t google sheet to markdown using this tool here: https://tabletomarkdown.com/convert-spreadsheet-to-markdown/)
This is an ordered list of major pieces of functionality created in an intentional order to help you incrementally create a larger project that works. Each deliverable is a significant piece of functionality that should be completed before the next deliverable starts. While it is often true that one deliverable must be delivered before another can be accomplished, deliverables do not have to have dependencies on one another. This means that two deliverables can be developed in parallel by different members of a team.
Oftentimes we will discover more deliverables along the way. This is fine. It is difficult (sometimes impossible) to know everything at the start of a project. Discovered work will be added to the Task List for following weeks, or as zero initial time estimates for the current week.
You should take your task milestones and add tasks for each milestone that are well defined, with time estimates.
Diagrams
At a minimum you must create a class diagram (and details) and sequence diagram. You could consider using Mermaid to create them (you do not need an account; be sure to save your mermaid text though so you don’t lose your work); search up what you can do at this link!. There are also extensions for visual studio that you can try out and use for creating these diagrams using mermaid chart syntax (I personally like using Markdown Preview Mermaid so you can include mermaid content directly inline in your markdown document).
-
Class Diagram: This diagram illustrates the static structure of a system by showing its classes, attributes, operations, and the relationships among objects. It provides a clear blueprint of the system’s architecture, essential for understanding how different components interact. There is an excellent reference and example on how to create class diagrams here. You can also read more about them on GeeksForGeeks.
Click to view Mermaid code
    classDiagram
        class User {
            -String userId
            -String name
            -String phoneNumber
            +register()
            +login()
            +updateProfile()
        }

        class Rider {
            -PaymentMethod[] paymentMethods
            +requestRide()
            +cancelRide()
            +addPaymentMethod()
        }

        class Driver {
            -String licenseNumber
            -Vehicle vehicle
            -double rating
            +acceptRide()
            +updateStatus()
            +endRide()
        }

        class Ride {
            -String rideId
            -Location pickupLocation
            -Location dropoffLocation
            -double cost
            -RideStatus status
            +calculateFare()
            +updateStatus()
        }

        class Vehicle {
            -String plateNumber
            -String model
            -int year
            +getDetails()
        }

        class PaymentSystem {
            +processPayment()
            +refundPayment()
        }

        User <|-- Rider : inheritance
        User <|-- Driver : inheritance
        Driver "1" -- "1" Vehicle : has >
        Rider "1" -- "*" Ride : requests >
        Driver "1" -- "*" Ride : accepts >
        Ride "1" -- "1" PaymentSystem : uses >
classDiagram class User { -String userId -String name -String phoneNumber +register() +login() +updateProfile() } class Rider { -PaymentMethod[] paymentMethods +requestRide() +cancelRide() +addPaymentMethod() } class Driver { -String licenseNumber -Vehicle vehicle -double rating +acceptRide() +updateStatus() +endRide() } class Ride { -String rideId -Location pickupLocation -Location dropoffLocation -double cost -RideStatus status +calculateFare() +updateStatus() } class Vehicle { -String plateNumber -String model -int year +getDetails() } class PaymentSystem { +processPayment() +refundPayment() } User <|-- Rider : inheritance User <|-- Driver : inheritance Driver "1" -- "1" Vehicle : has > Rider "1" -- "*" Ride : requests > Driver "1" -- "*" Ride : accepts > Ride "1" -- "1" PaymentSystem : uses >Diagram Elements:
-
Boxes: Classes with their properties and methods
- Upper section: Class name
- Middle section: Properties/attributes with
-for private and+for public - Lower section: Methods/operations
-
Arrows:
-
<|--: Inheritance relationship (Rider and Driver inherit from User) -
--: Association relationship with navigation direction (>) -
"1"and"*": Multiplicity/cardinality (1-to-1 or 1-to-many)
-
-
Boxes: Classes with their properties and methods
-
Sequence Diagram: Depicting the sequence of messages exchanged among objects, sequence diagrams detail how operations are carried out, including the order of interactions. They are instrumental in modeling the dynamic behavior of a system, especially for complex processes. You can also read more about them on GeeksForGeeks.
Click to view Mermaid code
sequenceDiagram
    actor R as Rider
    participant App as RideShareApp
    participant S as RideMatchingSystem
    participant D as Driver
    participant P as PaymentSystem

    R->>App: requestRide(location, destination)
    App->>S: findAvailableDrivers(location)
    S->>D: notifyRideRequest()
    D->>S: acceptRide()
    S->>App: confirmRideMatch()
    App->>R: displayDriverInfo()

    Note over R,D: Driver arrives at pickup location

    D->>App: startRide()
    App->>R: notifyRideStarted()

    Note over R,D: Ride in progress

    D->>App: endRide(destination)
    App->>P: processFare(rideDetails)
    P->>App: confirmPayment()
    App->>R: requestRating()
    R->>App: submitRating(stars)
    App->>D: updateRating()
sequenceDiagram actor R as Rider participant App as RideShareApp participant S as RideMatchingSystem participant D as Driver participant P as PaymentSystem R->>App: requestRide(location, destination) App->>S: findAvailableDrivers(location) S->>D: notifyRideRequest() D->>S: acceptRide() S->>App: confirmRideMatch() App->>R: displayDriverInfo() Note over R,D: Driver arrives at pickup location D->>App: startRide() App->>R: notifyRideStarted() Note over R,D: Ride in progress D->>App: endRide(destination) App->>P: processFare(rideDetails) P->>App: confirmPayment() App->>R: requestRating() R->>App: submitRating(stars) App->>D: updateRating()Diagram Elements:
- Actors: External entities (Rider)
- Participants: System components (App, Driver, etc.)
-
Arrows with Text: Messages between participants
-
->: Synchronous message (sender waits for response) -
-->: Response/return message -
->>: Asynchronous message (sender doesn’t wait)
-
- Notes: Additional context or explanations
- Vertical Lines: Lifelines showing object existence over time
-
Flow Chart Diagram: A flowchart diagram in a detailed design document shows the step-by-step logic of a process or method. It uses shapes like diamonds (decisions) and rectangles (actions) to represent control flow. Flowcharts are ideal for illustrating branching paths, loops, or procedural algorithms. They help readers visualize how specific game features or functions work internally. Use them when the logic is too complex for plain text or pseudocode alone. You can also read more about them on GeeksForGeeks. While not required you will find that explaining any algorithms or complex calculations easier with a flow chart. Consider using these where time based sequences are not key to the procedure.
Click to view Mermaid code
flowchart TD
  Start([Start Ride Request]) --> CheckUser{User Logged In?}
  CheckUser -- No --> Login[Display Login Screen]
  Login --> ValidateUser{Valid Login?}
  ValidateUser -- No --> Login
  ValidateUser -- Yes --> GetLocations
  CheckUser -- Yes --> GetLocations[Get Pickup & Destination]
  GetLocations --> CheckAvailable{Drivers Available?}
  CheckAvailable -- No --> Notify[Notify User No Drivers]
  Notify --> End([End Process])
  CheckAvailable -- Yes --> CalculateFare[Calculate Estimated Fare]
  CalculateFare --> ConfirmRequest{User Confirms?}
  ConfirmRequest -- No --> End
  ConfirmRequest -- Yes --> SendRequests[Send Request to Nearby Drivers]
  SendRequests --> WaitForAccept{Driver Accepted?}
  WaitForAccept -- No --> Notify
  WaitForAccept -- Yes --> MatchRide[Match Rider with Driver]
  MatchRide --> NotifyBoth[Notify Both Parties]
  NotifyBoth --> TrackRide[Begin Ride Tracking]
  TrackRide --> End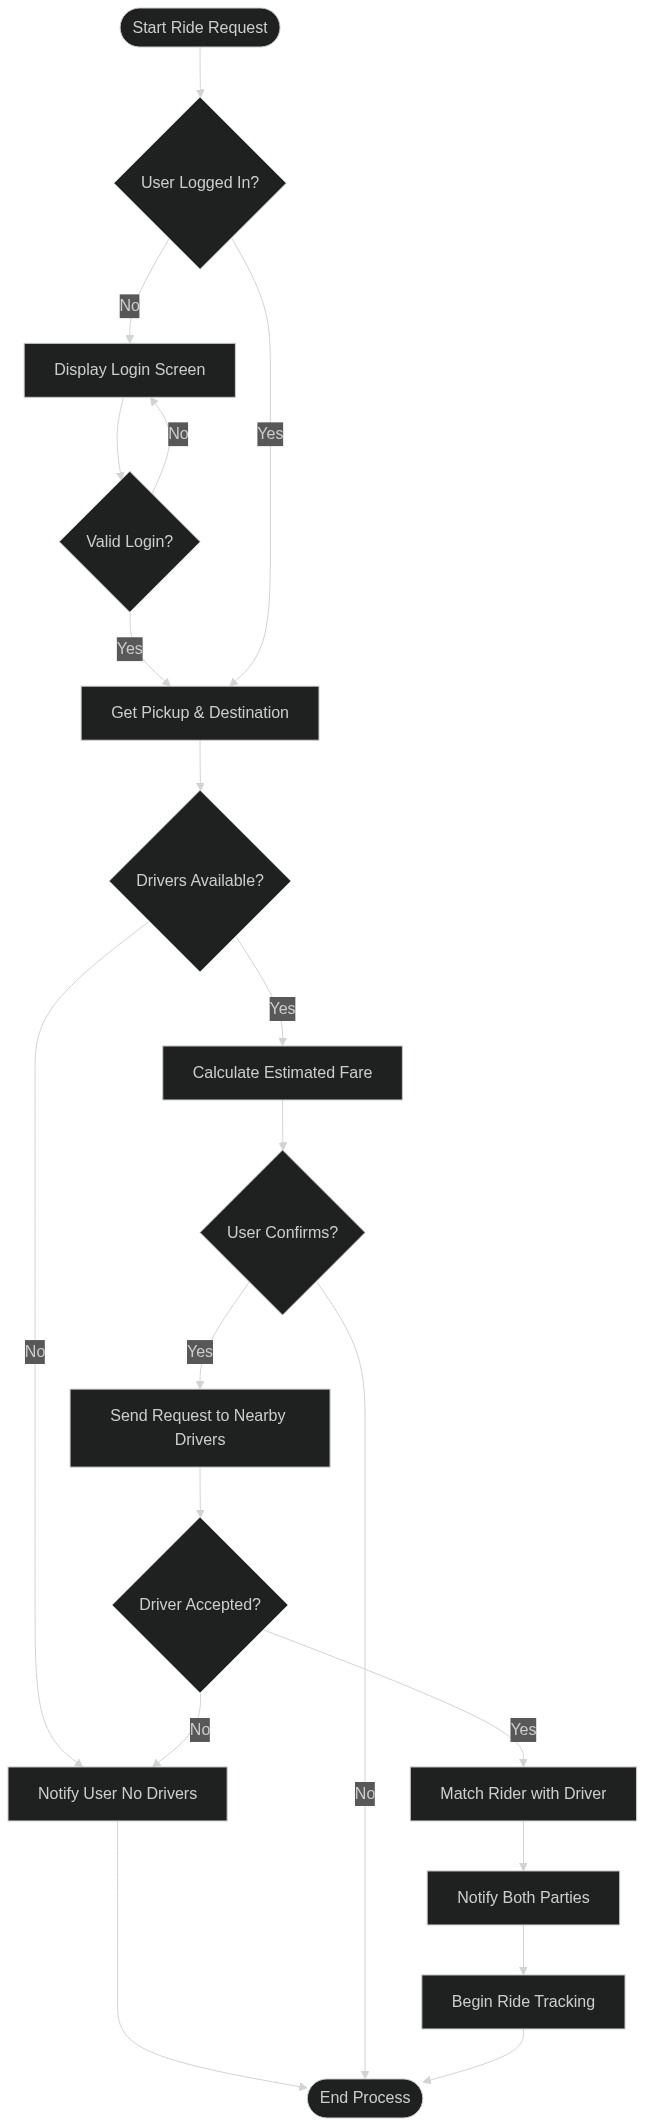
Diagram Elements:
-
Rounded Rectangles with Square Brackets
[]: Process steps/actions -
Diamonds with Curly Braces
{}: Decision points with multiple paths -
Rounded Capsules with Parentheses
([]): Start/End points -
Arrows: Flow direction
- Plain arrows: Standard flow
- Labeled arrows: Conditional paths (e.g., “Yes”, “No”)
- Vertical Arrangement: Time/sequence flows from top to bottom
- Horizontal Branches: Alternative paths based on decisions
-
Rounded Rectangles with Square Brackets
-
Depending on the features and/or scope of your project, you may want to include other kinda of diagrams as well. Listed below are a few examples, along with some use cases for them. Feel free to look other ones up!
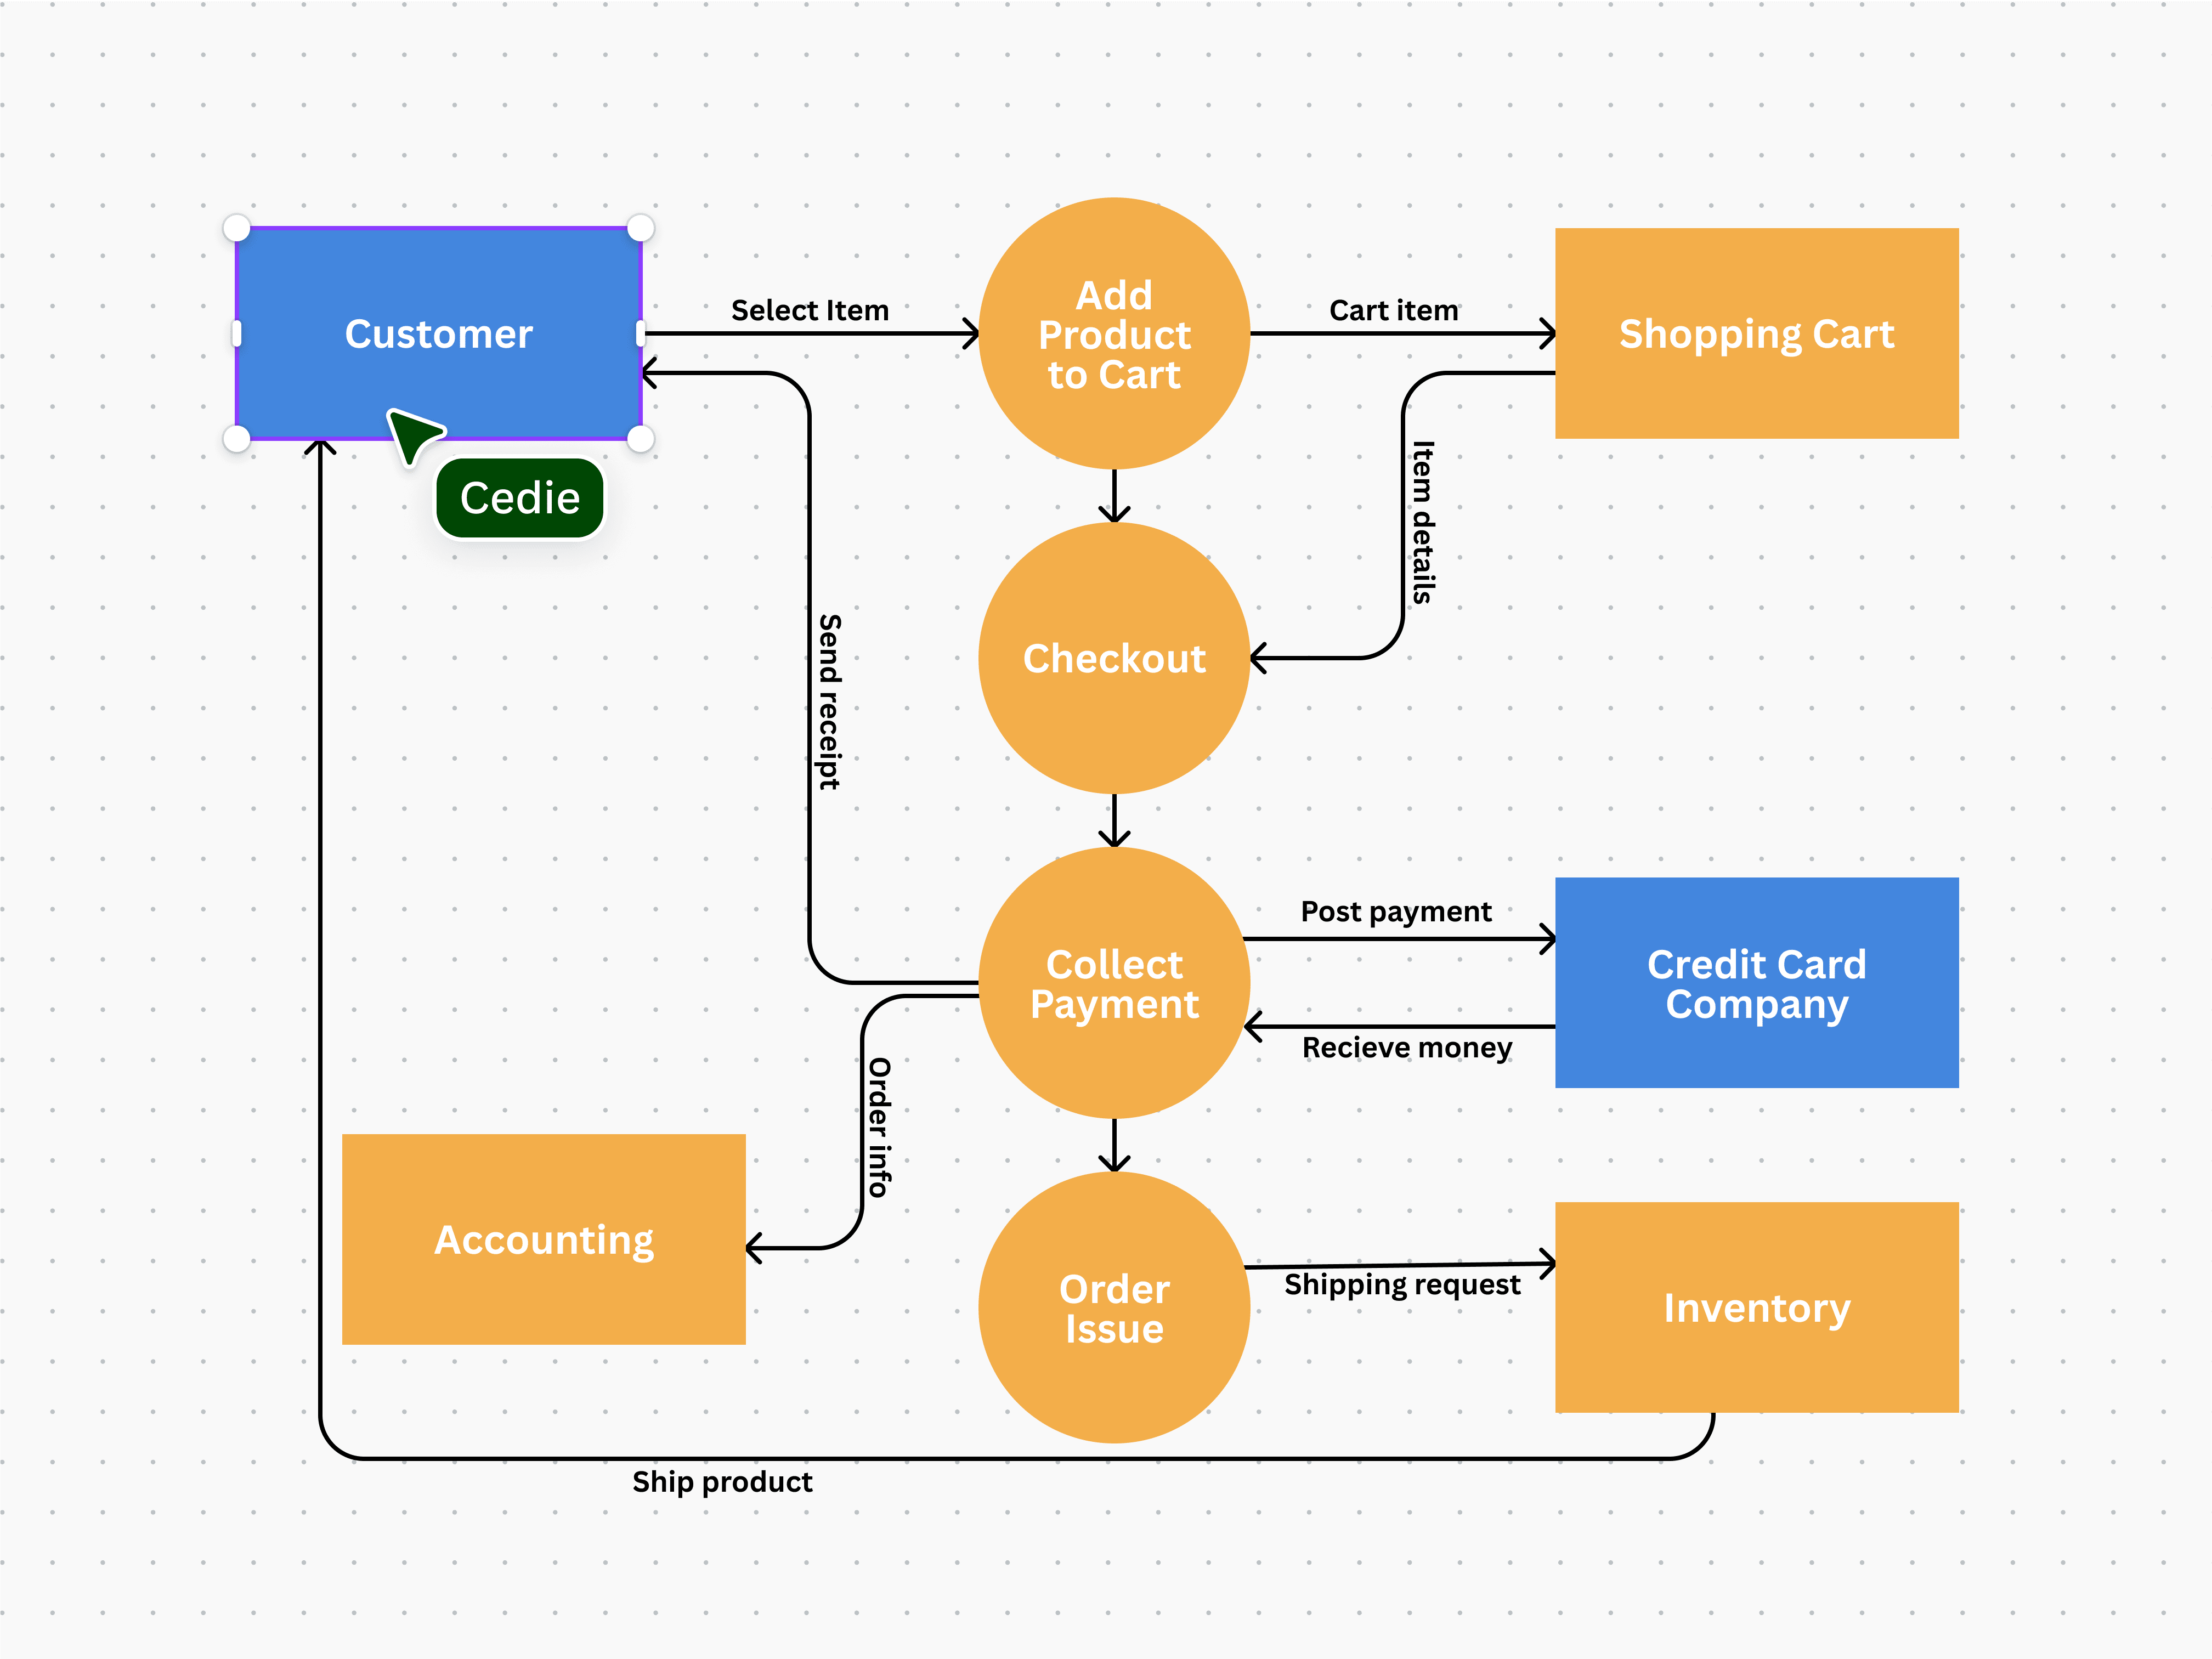
Data Flow Diagrams: Shows how data moves through your application, identifying inputs, processes, outputs, and storage locations. It helps clarify data dependencies and processing requirements. You can read more about them on GeeksForGeeks.
When to use: For applications with complex data processing, especially those dealing with multiple data sources, transformations, and storage systems. Ideal for:
- Data-intensive applications (analytics platforms, ETL systems)
- Applications with multiple external interfaces (payment gateways, APIs)
- Systems with complex business logic processing
Here’s an example for a customer buying something from a store. (from Canva)
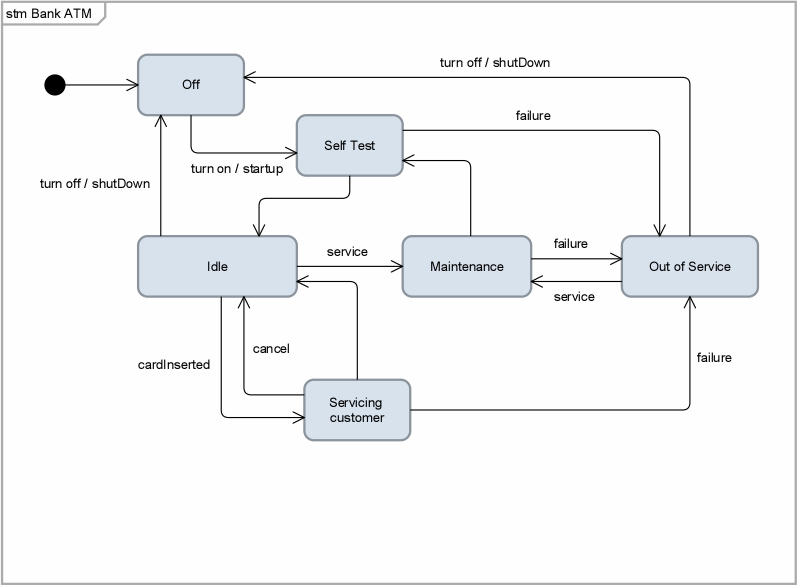
State Diagrams: Shows the different states an object can be in and how events trigger transitions between these states. They’re particularly valuable when behavior changes significantly based on state. You can read more about them on GeeksForGeeks.
When to use: For systems with distinct states and transitions, such as:
- Game development (character states, game progression)
- Workflow applications (document approval processes)
- Systems with complex life cycles (order processing, user account management)
Here’s an example for a Bank ATM. (from BizzDesign)
Class Roles & Responsibilities
Builing on the diagrams you created in the last section you should expand on the details for as many of your classes that you can identify and their roles & responsibilities. It could be that that will be enough. If you cannot list off at least three classes, the project is not complex enough.
Here’s an example:
| Class name | Roles & Responsibilities |
|---|---|
GameController |
|
Player |
|
MapGenerator |
|
EnemyAI |
|
UIManager |
|
Important Algorithms/Functionality
Clearly documenting key algorithms is essential for ensuring a well-structured and efficient implementation of your project. This section should highlight any complex or critical algorithms that will be developed, such as game loops, AI decision-making, pathfinding, data processing, or physics simulations.
Why is this important?
- It helps identify potential challenges early, allowing for better planning and problem-solving before coding begins.
- Ensures consistency in implementation, especially when working in a team, by providing a shared understanding of how key functionalities will operate.
- Serves as a reference throughout development, reducing confusion and making debugging more efficient.
- Helps prevent scope creep by defining the complexity of features in advance.
How detailed should this section be?
- Provide a high-level explanation of what the algorithm does and why it’s needed.
- Include a brief outline of the logic or steps involved (pseudocode or flowcharts can be useful but should remain concise).
- If applicable, mention key considerations like efficiency, potential bottlenecks, or alternative approaches.
- Avoid excessive detail—this is not a full implementation but rather a roadmap for development.
AI Pathfinding - The AI will use pathfinding to navigate around obstacles. The algorithm will work by evaluating possible movement nodes based on a heuristic function (estimated distance to the > goal) and the actual movement cost. This ensures the AI finds the shortest path efficiently. We will precompute walkable areas and optimize performance by limiting path recalculations.
 flowchart TD
     A[Start Pathfinding] --> B{Is Goal Reached?}
     B -- Yes --> G[End Pathfinding]
     B -- No --> C[Get Walkable Neighbors of Current Node]
     C --> H["Score Neighbors<br>& select lowest total"]
     H --> I{Recalculation Needed?}
     I -- No --> J[Move to Next Node]
     I -- Yes --> K[Recalculate Limited Path]
     K --> J
     J --> B
This level of detail provides enough guidance without overwhelming the design document with unnecessary complexity.
Approval
You must receive teacher approval to begin coding.