Introduction: The Ethics of Automated Decisions
In this unit, we explore Data Science Ethics—the study of how our data-driven systems impact human lives, safety, and systemic fairness. While data is often viewed as “objective,” it is a reflection of a world shaped by historical and societal biases. When we train machine learning models on this data, we risk building “black boxes” that don’t just predict the future, but actively enforce the prejudices of the past.
As you work through these case studies, you will move beyond “gut reactions” by using System 2 Thinking, a slower, more analytical mode of thought designed to catch implicit biases like confirmation bias. You will also grapple with the fundamental Accuracy-Fairness Trade-off: the reality that a model optimized for “accuracy” may inherently be “unfair” because it is conforming to biased real-world data.
We will analyze 5 real-world applications where data science intersects with human rights:
Criminal Machine Learning: Using facial features to predict “criminality” and the risks of algorithmically enforcing historical bias.
Location Tracking: The tension between public safety utility and the erosion of personal privacy through “anonymous” data.
COMPAS (Recidivism): How models can “discover” race through proxy variables (like home addresses) even when race is not an input.
Potholes in Baltimore: How reporting bias and differing levels of technological access can lead to inequitable city services.
Facial Recognition: The impact of under-represented groups in training data and the resulting disparities in model performance.
Your Goal: To perform a “risk-reward calculus.” You must determine if the value a tool adds to the world outweighs the potential for systemic harm, and what guardrails, such as interpretable models, can be used to make these systems ethical.
Case Study Topics
Be sure to read as much as you can on your topic - if you have additional time continue with the “Further Reading” sections if available.
Case Study 1: Criminal Machine Learning
Task
Read this article written by UW’s Carl Bergstrom and Jevin West.
Recap
Data scientists use models to not only make predictions but also to justify some phenomena (e.g., an interpretable machine learning model). While this is a useful endeavor, it can have some downfalls. Make sure you explore alternative hypotheses (maybe simpler ones) that are also likely to explain the phenomena. It would be best if you took the time to reflect on your explanation to check for any implicit biases present (e.g., confirmation bias). While it’s hard to spot implicit biases (because they are implicit), taking time to use your System 2 mode of thought can help catch them.
It’s incredibly important to start any data analysis project by asking who will use its results. Is it possible for someone to use this model to the detriment of other’s health, safety, or privacy? In the case of predicting criminality, there are some pretty scary possibilities of people in power abusing a tool like this to algorithmically enforce historic biases.
In general, it can be a bit tricky to navigate discussions of risk and value: It’s probably the case that you could argue that anyone can use any tool to cause harm, but that doesn’t mean we should never make new tools. It can help to think about the negatives in contrast to the value a tool adds to the world (e.g., think about negatives of not using those tools). If there is an excellent argument for value-added, then the calculus on risk-reward will be more difficult to navigate. It’s tricky to navigate since different people have different views on injury and value, but having that discussion in the first place is a critical first step.
Case Study 2: Location Tracking
Task
When another user pointed out a concern about a potential violation of the user’s privacy (tweet since deleted), Textronix replied:
Things to Consider
This case study sets up an interesting tension between utility (i.e. public safety) and user’s privacy. On one hand, we want to have accurate information to inform policy-makers on the general behaviors of people so they can make better informed policy decisions. But in some cases, this utility can come at the cost of someone’s personal privacy.
Now, Tectronix claims (from the tweet above) that there are no privacy concerns here since they collected the data with users’ consent and kept the data anonymous. While we assume this is true, there are still a couple potential gray-areas here.
Anonymous data sometimes isn’t: You’ll find that it’s surprisingly easy, given enough information, to narrow down a large dataset with anonymous data, down to a single individual that you are looking for. In that lesson, we will talk about some techniques to ensure anonymity, but the key point is that it’s challenging and rarely sufficient to just remove the users’ name from the data.
What did the users consent to? While the users might have consented to the collection of their data, the details of that consent are fairly important for us to consider whether using their data in this way is appropriate.
Many of us have probably had the experience of downloading the new app, and clicking through the “Terms of Conditions” as fast as we can just so we can get to the good stuff. This usually means by clicking the “I agree” button, you are (usually) consenting to the company using your data in a very generous manner without many restrictions. While we aren’t lawyers, we assume many uses of data, including publishing anonymous maps like this, do not pose any legal complications. So if it’s legal, does that make it totally fine? Many privacy experts agree that legality is not enough, since our current laws might not accurately reflect the impact and importance of data. In fact, the European Union recently overhauled their data privacy laws with the introduction of GDPR; a move that vastly increased user’s privacy rights that companies with European customers must abide by.
There is an additional question here of exactly what the scope of consent users agree to. An example (mentioned in the New York Times article linked below): If a user downloads a weather app, and consents that the company use their location data to improve their ability to provide a better service for the customer, is it allowed for that weather app to sell location data to advertisers? Some might claim that the advertising brings in money, that lets the developers of the app improve the software they use. But others might claim that the user was really giving a much narrower consent that might make it an ethical issue for companies to use that data in scopes where consent was not provided.
Further Resources
Read this New York Times piece on the use of “anonymous” location data to identify particular individuals and learn about their regular habits.
Case Study 3: COMPAS
A few years ago, a company named Northpointe made a machine learning system to help judges decide how to rule on parole. The name of this system was COMPAS (they are into directions, I guess). The idea of the model was to try to predict how likely it would be for someone leaving jail to commit a crime. Committing a crime after serving time in prison is called “recidivism.” Their model was trying to predict someone’s risk of recidivating after they leave jail from the answers to a quiz they filled out. The questionnaire asked questions about their identity, where they lived, what their job was, etc.
ProPublica (a non-profit newsroom) analyzed the results of COMPAS scores and concluded that the system was biased against people of color. In particular, they found that the system was more likely to predict a higher recidivism risk for black people than white people. Northpointe countered ProPublica’s findings by claiming that their scores were accurate in the sense that if they predicted a score of 9 for anyone (regardless of race), there was a 90% chance they would recidivate.
So the question then is: Which one of these groups is right, and is it ethical to use this system to determine who gets parole? Surprisingly, it turns out that both ProPublica and Northpointe’s arguments are backed up by the data.
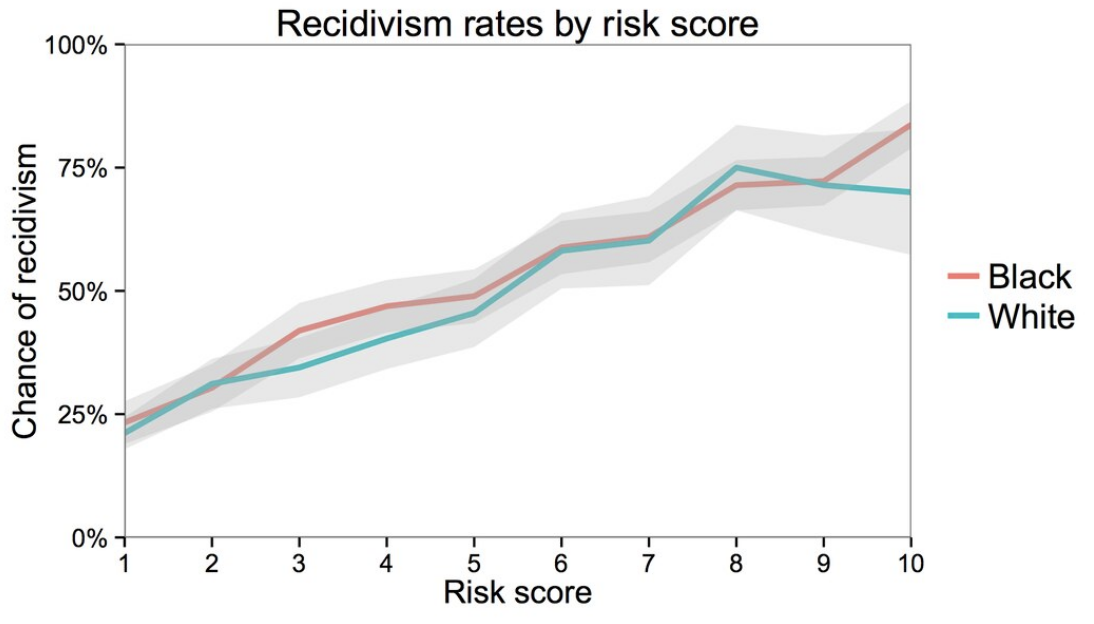
Northpointe’s argument is backed up by the following graph. The x-axis shows the predicted risk score (scaled from 1-10, where a higher is more likely to recidivate). The y-axis shows the actual recidivism rate for those people after they did leave jail. The fact that these lines are close to the line demonstrates Northpointe’s point. So of the people that predict a risk score of 0.8, about 80% of the time they recidivate. Additionally, when separated as accuracies for black and white people, you see that the lines are mostly the same (the gray region is a confidence interval to capture uncertainty in the estimate).
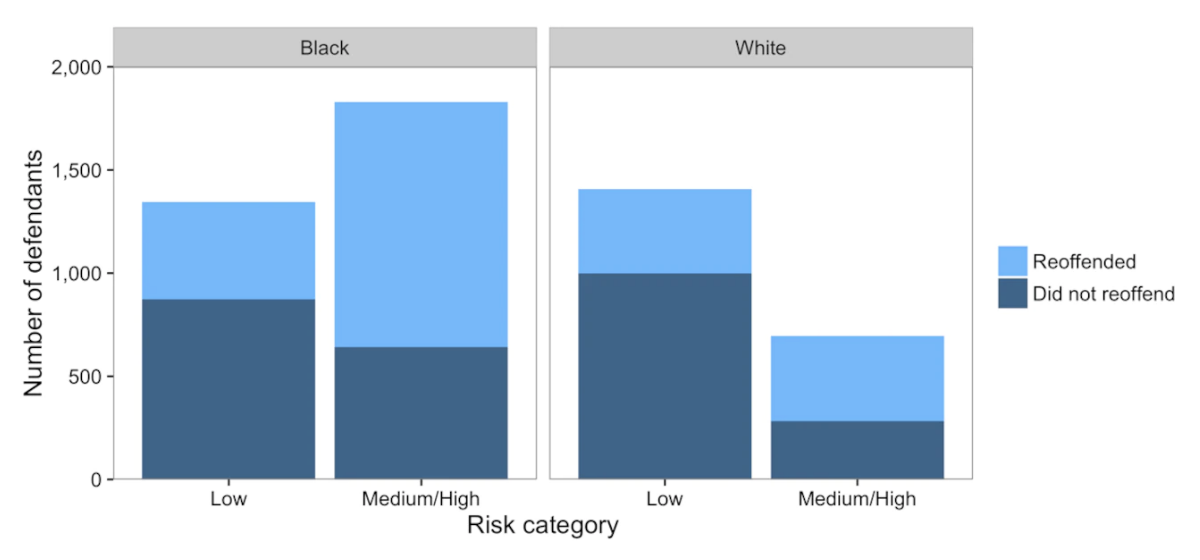
ProPublica’s point is backed up by the following chart. This chart separates the data into black/white people and then within those groups breaks the people up into low and medium/high risk and shows the count of each group. The risk group comes from whether or not COMPAS predicted a small, medium, or high score. The coloring shows which of the people in each group did re-offend and those that didn’t. ProPublica claims that the percentage of people shaded dark blue (those that ultimately did not re-offend) in each race, a more substantial proportion of black people get labeled as medium/high risk. The conclusion from this claim is that if you would genuinely not recidivate, the system is more likely to give you a higher risk if you’re black. They use this as justification to say this model exhibits racist behavior and that judges shouldn’t use it.
The first thing to ask is, where does this bias come from? Surprisingly, it turns out that race isn’t even a question that Northpoint asked on the questionnaire. This means that the model doesn’t even have race as an input. This doesn’t stop the model though, because it’s able to do many correlations to “discover” someone’s race using other features (like their home address, income level, name, etc.). These features can be correlated with race, so the model is not truly “color-blind.”
I would bet that no one at Northpointe coded up the model to be racist (e.g., IS_RACIST = True ) explicitly. In many cases, models that show biased behavior tend to not do so intentionally on the part of the programmer. Unfortunately, the data we give these models is biased because our society has biases around every corner. Regardless of using a machine learning model or not, your treatment by the criminal justice system is, unfortunately, impacted by your race. If we use data from this biased system, the data itself will obviously be biased. The model can then pick up on these biases and reflect them in their decisions. Just as a simple example, the relative incarceration rate for people of color is much higher than white people. The model picks up on this correlation and then uses it for future judgments, without taking into account the historical or societal causes for that difference.
Fairness in Machine Learning
Right now, a big open question in machine learning and data science is how to accurately define fairness so that we can ensure that our models are fair. A simple set of rules for a fair COMPAS model might be something like:
Equally accurate in predicting recidivism across subgroups (e.g., race).
Members for different subgroups have the same chance of being wrongfully predicted to recidivate (if you truly would not recidivate, your risk score should be the same regardless of race).
Failure to predict recidivism happens at the same rate across subgroups.
Computer scientists have shown that it’s not possible to satisfy all 3 in most real-world scenarios (unless the groups have exactly the same characteristics). Unfortunately, this is unlikely to happen in the real world as long as we have these current and historical injustices towards subgroups. This essentially means that there is a fundamental tradeoff between accuracy and fairness for real-world applications. A fairer system will need to give up some accuracy by some amount, since the definition of accuracy is conforming to the existing biases in the data. Additionally, different definitions of fairness can contradict each other! There is a lot of research to figure out how to identify the right level of tradeoff and the appropriate use cases for each definition of fairness.
Being biased is easy. How do we fix it?
So is the COMPAS algorithm racist? In some sense, no, since it’s not a person and has no sentience. But in a sense of thinking about outcomes that it makes, yes, since a person’s race can cause differential impact. As we’ve stated before, this bias sneaks in from the data that we learn from itself, rather than the model. This is in-line with the broader notion of “systematic racism” that, as a society, we have become increasingly aware of. This is more pronounced In recent years of the injustice of lives tragically lost in interactions with police.
Systematic racism is broad, but it’s important to point out that many systems that enshrine racism, don’t do so with malicious intent. Many systems try to be “color-blind”, but that can sometimes just perpetuate biases that exist in the system. As we mentioned before, the model wasn’t explicitly told about race and was still able to demonstrate biased behavior because it could correlate other features with race. So even if “color-blind” was an ideal (not saying that it is), it’s very difficult to achieve.
One idea is to try to explicitly code race into the model, and make sure you use some mechanism to force the model to be fair concerning race. So in some sense, you could think of using race as a feature to prevent racism. This is a promising approach, but often is illegal to do in the first place! Many laws are in place to prevent people from using race as part of a decision to avoid racist behavior in the first place (e.g, credit scores). In that light, we might need to update these laws to account for the fact that these machine learning systems might need this information to prevent biased outcomes.
Another big approach is to use interpretable models. An interpretable model is one that can explain its decisions. For example, think of the neural network model we learned last week. These models are considered black-boxes because it’s complicated to interpret why they made the decision they did. Compare that to a decision tree, where it’s apparent which decisions led the example down the tree to the ultimate choice. If we have these interpretable models, we can hand-check the model to prevent biased decision making. It turns out that black-box models tend to be more accurate in practice, but lots of research is going into making interpretable models that do well in practice (some of that is happening in the Allen School).
Most importantly, always be looking for bias in your datasets to prevent these models from learning from this bias. This is not easy in practice because bias can sneak in very subtly (as we will see in the next case study), but it is a crucial thing to look out for.
Further Resources
Fairness in machine learning is a relatively new field. FAccT* Conference .
Case Study 4: Potholes in Baltimore
Task
Read these details on the app created below and a related news article link.
The city of Baltimore has problems with potholes (holes in the street that are not fun to drive over). Part of the city’s responsibilities is to fix these potholes to make roads safer. There has always been a system in place for people to report these potholes, but the process was slow. The city invested in building a smartphone app to automatically report potholes and reduce the time it takes to fix potholes. The idea was to use someone’s phone GPS and accelerometer to report the pothole’s location as someone drives over it. Then it’s a data science problem at that point to take this incoming data and predict where the potholes are.
While this case study sounds less risky at first (maybe even like a useful application of data science), it demonstrates a very dangerous pitfall data scientists face. To benefit from this technology, it requires that people have a smartphone. That means areas where residents are less likely to have smartphones, are less likely to have these automatic reports sent in. This can be a real fear that these more impoverished communities will be left behind, as more resources are sent towards the more affluent neighborhoods with more reports, purely because there are more people with smartphones there.
In some sense, the city added a reporting bias to their system. A reporting bias exists when there is some reason the answers reported differ from the truth. An example of reporting bias is asking a married person, “Have you cheated on your spouse?” The answers people say are most likely biased towards “no” since there is a risk of reporting truthfully. Here, the reporting bias comes from differing levels of technological access.
When designing a data analysis, application, or model, you need to think carefully about how it impacts people of different races, genders, physical or mental abilities, socioeconomic status, etc. (and how it can affect intersecting identities). Thinking of diversity and inclusion is crucial for a data scientist since we want to make artifacts that benefit all people.
One approach you might consider solving this problem of different access or needs would be to design something to the “average person.” This isn’t always the best idea since your definition of “average” could put certain groups at a disadvantage. Additionally, it’s still not apparent that designing for the average helps anyone at all. Instead, you want to think about how you can create a modular or customizable system to work for any person’s individual needs.
Article: Beware the Pothole
Case Study 5: Facial Recognition
Task
Update: Use later articles for this one (from 2018): e.g. [here]
Read this article on the use of facial recognition in machine learning.
Recap
The data we use to train our model affects the results of our model. It’s possible for our model to be biased towards/against certain groups, simply from having a group under/over represented in our dataset. Thus, it is important to evaluate the diversity in your dataset and evaluate our results on a diverse dataset and to keep in mind what we are using this model for.
Further reading:
See this talk by Joy Buolamwini on how her research helps fight bias in algorithms.